


 이미지 확대보기
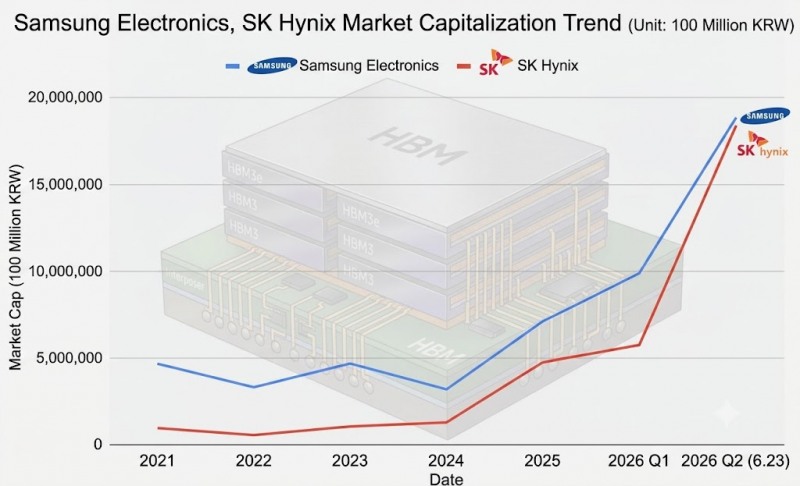
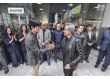
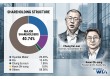
As of the closing price on the 22nd, SK hynix's market capitalization stood at KRW 2,080 trillion, surpassing Samsung Electronics' KRW 2,067 trillion to claim the No. 1 spot among individual listed stocks. Samsung Electronics pushed back through a statement, saying that "a company's market cap is the total sum of share value including both common and preferred stock." By this measure, Samsung Electronics' market cap, including preferred shares, stands at KRW 2,252 trillion — still No. 1. Nonetheless, the market appears to be paying greater attention to the symbolic significance of the No. 1 stock changing hands for the first time in 27 years since 1999.
As recently as the end of 2023 — just two years and six months ago — Samsung Electronics' market cap (common stock) was more than 4.5 times that of SK hynix. The gap between the two narrowed sharply after the end of the first quarter of this year, before reversing for the first time ever. What was it that allowed SK hynix to catch up with Samsung Electronics' market cap so abruptly?
 이미지 확대보기
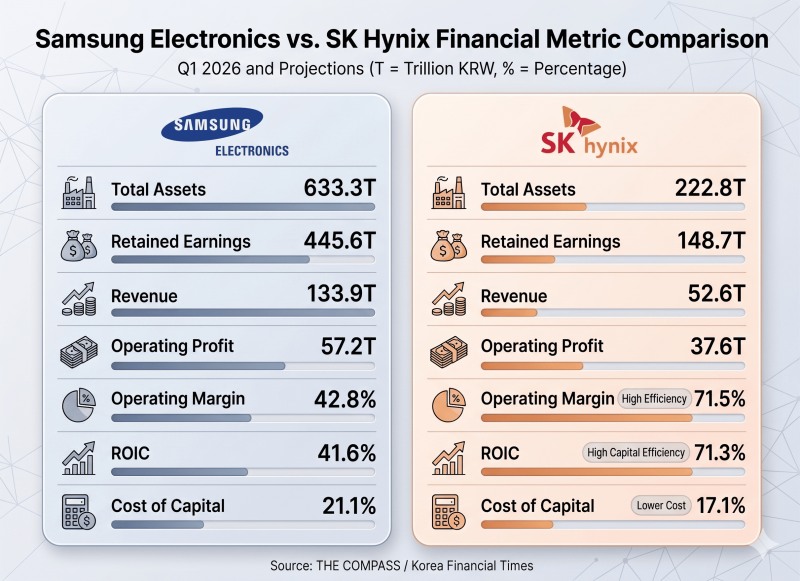
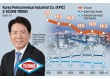
There is no dispute that Samsung Electronics boasts overwhelming scale compared with SK hynix. As of the end of the first quarter of this year, Samsung Electronics' total assets are 2.8 times larger and its revenue roughly 2.6 times greater. Its retained earnings — the funds accumulated from the profits earned through corporate activity — are also three times larger.
The premium SK hynix has received from the market is capital efficiency. Even with less capital invested, it generates returns at a far higher rate of efficiency.
 이미지 확대보기
관련기사
Samsung Electronics Surpasses 30% NAND Market Share, Bolsters 'Super-Gap' Lead Through NVIDIA AllianceSK hynix Eyes KRW 40 Trillion in Q1 Operating Profit — Is AI Ushering in a Long-Term Boom?Once Samsung's Cash Cow, Galaxy Now Teeters on the Brink of a LossSK Hynix Weighs Growth Over Governance in Treasury Share Strategy [Treasury Share Report]Exynos Reborn: How Samsung Is Betting Its Chip Future on On-Device AI
In calculating invested capital (IC), the denominator of ROIC, this platform applies a conservative standard that does not exclude short-term financial instruments and the like. This is done to gauge a company's actual capacity to utilize its funds. Samsung Electronics, which holds an enormous volume of non-operating financial assets, faces the disadvantage of having its capital efficiency assessed as relatively lower.
In addition, the cost of capital (WACC) was derived using a free cash flow (FCF) reverse-calculation method. For Samsung Electronics' projected 2026 FCF of KRW 88.4 trillion to justify its market cap as of the end of the first quarter, the company must prove a high average annual growth rate of 27.3% over the next 10 years. By contrast, the average annual growth rate the market demands of SK hynix under the same standard was set at 22.8%, lower than that of Samsung Electronics.
Ultimately, SK hynix's profit-generating capacity, which far exceeds what the market requires, is interpreted as the key factor explaining its recent runaway share-price gains and market-cap premium.
SK hynix adds strategic momentum to its earnings cycle
The indicators above reflect annual projections based on first-quarter financial data this year.In the first quarter, the price of commodity DRAM exceeded that of high-bandwidth memory (HBM), creating a favorable environment for Samsung Electronics, which has a large scale and high proportion of commodity semiconductors.
Moreover, Samsung Electronics' device (DX) division — including smartphones and home appliances — tends to peak in the first quarter and decline from the second through fourth quarters.
As a result, SK hynix's capital efficiency is expected to stand out even more from the second quarter onward.
SK hynix's listing of American depositary receipts (ADRs) in the U.S., projected to be completed in August, is also analyzed as contributing to the share-price rise.
Expectations are growing not only for inflows of global passive funds but also for a re-rating of the company's value. According to Hanwha Investment & Securities, SK hynix's 12-month forward price-to-earnings ratio (PER) stands at 6.6 times — undervalued compared with U.S.-based Micron, which commands more than 10 times.
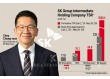
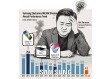
Chey Tae-won, chairman and owner of SK Group, has also been actively promoting SK hynix's future strategy, citing specific figures. This also has the effect of lowering the risk of future uncertainty for investors. Attending Computex 2026, Taiwan's largest IT expo, earlier this month, Chairman Chey said, "Driven by surging demand for AI memory, shortages of memory such as HBM will persist until 2030," adding, "We will expand our total wafer production capacity to double the current level."
For Samsung Electronics, success of HBM4 is the key
Samsung Electronics' relatively low capital efficiency stems from the existence of low-margin business units such as non-memory (System LSI and Foundry) and the DX division. Over the long term, once the AI era fully arrives, a diversification strategy that reduces dependence on memory could contribute to enhancing corporate value. In the current AI memory super-cycle phase, however, attention is concentrating on SK hynix, which has maximized profitability by simplifying its business structure.For now, Samsung Electronics is focused on securing market leadership through HBM4 (sixth generation). Samsung Electronics' HBM4, which combines its cutting-edge 10-nanometer-class 1c DRAM with a 4-nanometer foundry process, began the world's first mass-production shipments in February. Samsung Electronics still faces the task of proving whether its recovery in HBM4 technological capability translates into actual earnings.
Gwak Horyung (horr@fntimes.com)
데일리 금융경제뉴스 Copyright ⓒ 한국금융신문 & FNTIMES.com
저작권법에 의거 상업적 목적의 무단 전재, 복사, 배포 금지
가장 핫한 경제 소식! 한국금융신문의 ‘추천뉴스’를 받아보세요~


