


 이미지 확대보기
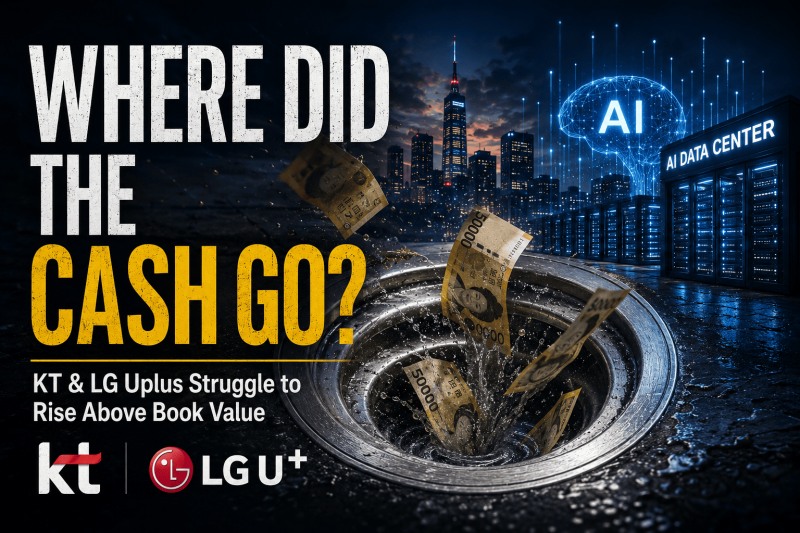
Cash-generating power has recovered, but the market's assessment has barely budged. A corporate value that falls woefully short of book value — this is the reality facing Korea's three telecom carriers today.
As demands for shareholder returns to resolve the Korea Discount collide with trillion-won upfront investments in AI infrastructure, the burden of capital management keeps growing. Ultimately, the key to breaking the chronic undervaluation is not simply expanding dividends. It lies in successfully settling the enormous investments now being poured out into high-margin businesses, and proving this through tangible improvement in capital efficiency.
Korea Financial Times conducted an in-depth analysis of the first-quarter 2026 management performance of SK Telecom, KT, and LG Uplus based on its proprietary AI data platform "THE COMPASS." The results showed that the three carriers face different challenges in terms of profitability, growth, and capital efficiency.
Three Carriers, Three Colors, Revealed Once One-Off Effects Are Stripped Away
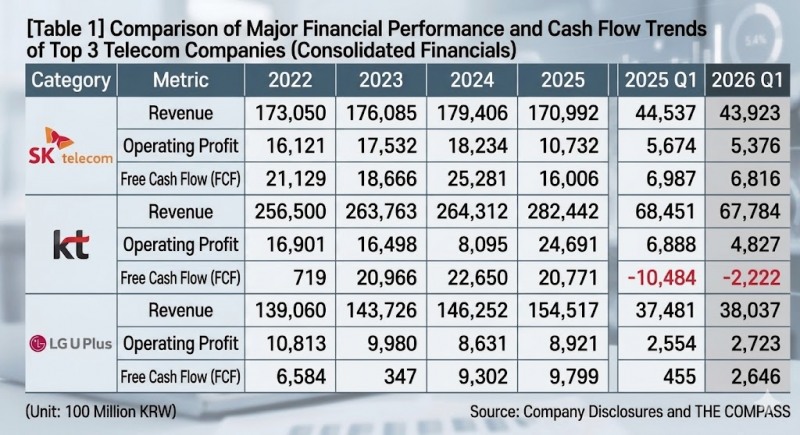
On the surface, all three carriers show an improving trend in cash generation. However, once the one-off factors reflected in the 2025 results are excluded, the differences in fundamental competitiveness become more distinct.KT's full-year 2025 revenue was KRW 28.2441 trillion and operating profit KRW 2.4691 trillion, marking a sharp increase from the previous year. However, this was largely driven by the one-time recognition of roughly KRW 1.1 trillion in real estate sales revenue from its subsidiary NextConnect PFV, as well as a partial windfall benefit from a competitor's security breach. With the one-off factors gone, KT's first-quarter 2026 revenue came in at KRW 6.7784 trillion, down 0.97% year-on-year. As the only negative growth among the three carriers, this confirms a stagnant phase in terms of core-business growth.
관련기사
SK Telecom's 2025 operating profit decline, by contrast, was different in nature. While operating profit fell sharply to KRW 1.0732 trillion from KRW 1.8234 trillion a year earlier, this was largely due to a concentration of one-off costs — roughly KRW 700 billion in customer compensation costs and KRW 134.8 billion in fines stemming from the USIM (universal subscriber identity module) data leak incident, a major breach of mobile subscriber data disclosed in 2025. With this burden removed, SK Telecom in the first quarter of 2026 posted operating profit of KRW 537.6 billion and an operating margin of 12.24%, the highest profitability among the three carriers. KT leads in revenue scale, but SK Telecom held the edge in profitability.
Stripping away the one-off factors reveals each carrier's profit-generating structure. SK Telecom's total asset turnover ratio is 0.8 times, the lowest among the three. Rather than aggressively expanding assets, it appears focused on defending the profitability of its existing wireless business. LG Uplus, by contrast, posted first-quarter 2026 revenue of KRW 3.8037 trillion, the only one of the three to grow year-on-year. This is interpreted as a reflection of its emphasis on top-line growth through aggressive investment, such as the construction of the Paju AI Data Center (AIDC).
 이미지 확대보기
Generating Cash, but Failing to Clear the Cost of Capital
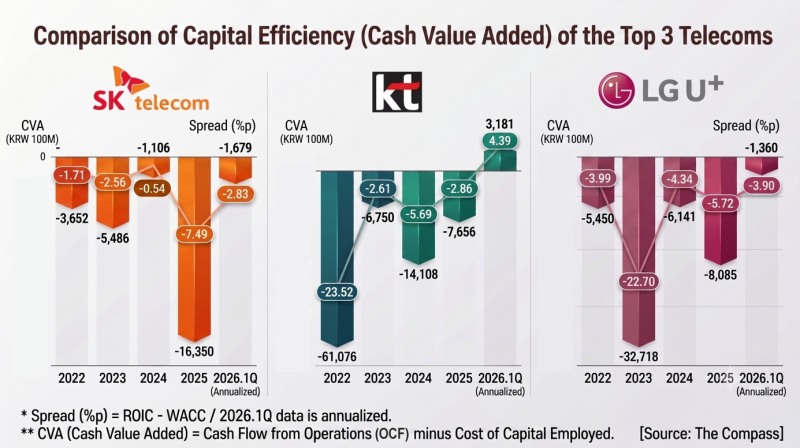
The three carriers' strategies diverge, but their common challenge is clear: a capital-efficiency problem in which they fail to generate sufficient returns relative to the capital invested.Capital efficiency is typically measured through Economic Value Added (EVA). However, under the current IFRS disclosure framework, the level of disclosure for the items needed to calculate NOPAT (net operating profit after tax) varies by company, making it difficult to compare the three carriers on the same basis. Accordingly, this article analyzed capital efficiency on an actual-cash basis using Cash Value Added (CVA) — the operating cash flow (OCF) that all three disclose in common, minus the cost of capital on invested capital (invested capital × WACC).
The results, measured against actual cash inflows rather than book profits, were harsher than expected.
As of the first quarter of 2026, the CVA spread (ROIC – WACC) was -2.83 percentage points for SK Telecom and -3.90 percentage points for LG Uplus. This means the cash earned through operating activities fails even to offset the cost of raising capital. Notably, on a CVA basis, both SK Telecom and LG Uplus have remained in negative territory every year since 2022, underscoring that this is a structural rather than a one-quarter phenomenon. Although cash-generating power is improving, it still falls below the cost of capital — interpreted as the reason the market does not assign telecom a high valuation.
KT, by contrast, showed improvement relative to its rivals, with CVA of KRW 318.1 billion and a spread of 4.39 percentage points — the only positive reading any of the three carriers has posted since 2022. Although it executed more than KRW 870 billion in CAPEX in the first quarter alone, turning FCF negative at -KRW 222.2 billion, its cash-based capital efficiency entered positive territory. It is premature, however, to conclude that this is a structural turnaround. With slowing growth confirmed, the key variable is whether aggressive upfront investment can translate into improved future profitability and capital efficiency.
As such, all three carriers bear the burden of large-scale investment to respond to the AI infrastructure race. KT is pursuing 500MW of data center capacity by 2030, and SK Telecom 300MW. On top of this, following the 2025 security breach, a plan to invest a total of KRW 2.4 trillion in security infrastructure over the next five years has also been laid out. As the scale of capital that must be deployed grows faster than profit, an environment is forming in which structural improvement in capital efficiency is far from easy.
 이미지 확대보기
Why PBR and the Z-Score Move Together
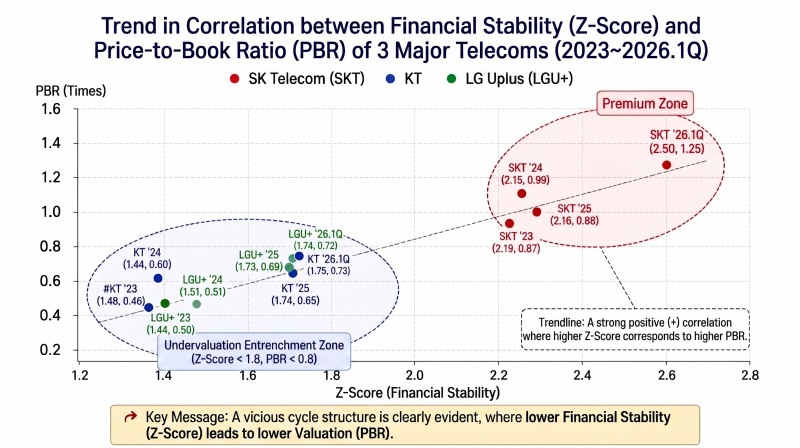
The market's assessment reflects this structure to a certain degree.Looking at the trend in the Altman Z-Score, which indicates a company's overall financial soundness, SK Telecom has climbed from 2.09 in 2021 to 2.49 in the first quarter of 2026, sustaining a relatively stable trajectory. KT, by contrast, stood at 1.74 and LG Uplus at 1.73, both stuck in a box range in the 1-point band for five consecutive years. Both companies have failed for years to escape the danger zone by Z-Score standards (below 1.81).
This trend largely aligns with market valuation, expressed as the price-to-book ratio (PBR), as well. Currently, PBR stands at 0.73 times for KT and 0.72 times for LG Uplus, falling short of even their book value. SK Telecom, on the other hand, commands a premium at around 1.25 times.
Behind this lies the "retained earnings-to-total assets ratio (X2)," a core component of the Z-Score. On this metric, which reflects the scale of profit accumulated over time, SK Telecom maintains a high level of 0.83. KT, by contrast, stands at just 0.34 and LG Uplus at 0.27.
The market grants a relatively high premium to companies with a strong ability to accumulate earnings over time. Conversely, it applies a discounted value to companies with a weak earnings-accumulation base. As a result, market capitalization is constrained, and the Z-Score component representing market value relative to liabilities (X4) weakens in tandem. Ultimately, a structure forms in which an "entrenched Z-Score danger zone" and an "entrenched sub-1x PBR" reinforce each other.
 이미지 확대보기
Monetizing AI Investment Will Decide Value-Up
The three carriers have recently rolled out aggressive shareholder-return policies to resolve the Korea Discount. SK Telecom has proposed dividends of more than 50% of net profit, while KT announced a plan to buy back KRW 1 trillion worth of treasury shares by 2028. LG Uplus is also putting forward dividends of more than 40% of net profit along with share buybacks.Expanded shareholder returns can be viewed positively in the capital markets. However, without the backing of investment for future growth, it is hard for them to translate into long-term gains in corporate value. The telecom industry is currently in a situation where it must solve two challenges simultaneously — AI infrastructure investment and shareholder returns. In the end, what matters is not the size of the dividend itself, but the efficiency of capital allocation.
Whether the three carriers achieve value-up hinges on monetizing their AI investments. The key to escaping undervaluation is whether the results of AI investment connect to improved capital efficiency. The moment AI data centers and the B2B business prove they can generate returns exceeding the cost of capital, the market's assessment, too, may change.
This article is provided for informational purposes only and does not constitute investment advice or a recommendation to buy or sell any security. Figures are based on the companies' disclosures and Korea Financial Times' proprietary analysis.
Doo KyoungWoo (kwd1227@fntimes.com)
데일리 금융경제뉴스 Copyright ⓒ 한국금융신문 & FNTIMES.com
저작권법에 의거 상업적 목적의 무단 전재, 복사, 배포 금지
가장 핫한 경제 소식! 한국금융신문의 ‘추천뉴스’를 받아보세요~


